Choosing between Sentry and Amazon CloudWatch comes down to one question: are you monitoring your application or your infrastructure?
Sentry is a developer-first error tracking tool that catches application-level bugs, crashes, and performance issues with detailed stack traces. CloudWatch is AWS’s native monitoring service that tracks infrastructure metrics, collects logs, and triggers alarms across your entire AWS environment.
The short answer: most production teams use both — Sentry for catching bugs and CloudWatch for watching infrastructure. But if you can only choose one, this guide will help you decide.
| Feature | Sentry | Amazon CloudWatch |
|---|---|---|
| Primary focus | Application error tracking | AWS infrastructure monitoring |
| Error tracking | Excellent — stack traces, breadcrumbs, grouping | Basic — log pattern matching only |
| Performance monitoring | Transaction tracing, web vitals | Metrics, custom dashboards |
| Log management | Limited (focused on errors) | Comprehensive — CloudWatch Logs |
| Alerting | Issue-based alerts, Slack/PagerDuty/email | Metric alarms, composite alarms, SNS |
| Setup time | ~10 minutes (install SDK) | Already enabled for AWS services |
| Language support | 30+ languages and frameworks | Language-agnostic (log-based) |
| AWS integration | Via SDK (works anywhere) | Native — built into every AWS service |
| Free tier | 5K errors/month, 10K transactions | 10 custom metrics, 10 alarms, 5GB logs |
| Paid pricing | From $26/month (Team plan) | Pay-per-use (varies widely) |
| Best for | Developers debugging application bugs | Ops teams monitoring AWS infrastructure |
Sentry is an open-source application monitoring platform that specializes in real-time error tracking and performance monitoring. When your code throws an exception, Sentry captures it immediately with the full context: stack trace, user information, browser details, breadcrumbs (the sequence of events that led to the error), and the exact line of code that failed.
TypeError hits 500 users, you see one issue with a count of 500.JavaScript, TypeScript, React, Next.js, Vue, Angular, Python, Django, Flask, Node.js, Express, Java, Spring, Go, Ruby, Rails, PHP, Laravel, .NET, Rust, Swift, Kotlin, Flutter, React Native, and more — over 30 platforms.
Amazon CloudWatch is AWS’s built-in monitoring and observability service. It collects metrics, logs, and events from virtually every AWS service and provides dashboards, alarms, and automated responses.
EC2, Lambda, RDS, DynamoDB, S3, ECS, EKS, API Gateway, SQS, SNS, Kinesis, Step Functions, CloudFront, Elastic Load Balancing, and virtually every other AWS service.
This is where the two tools diverge the most.
Sentry was built specifically for error tracking. When an unhandled exception occurs in your application:
CloudWatch approaches error tracking differently. It relies on log-based error detection:
"ERROR" or "Exception"The difference: Sentry gives you “This TypeError: Cannot read property 'id' of undefined started in release v2.3.1, affects 342 users, happens on the checkout page, and here is the exact code.” CloudWatch gives you “Your application logged 47 lines containing the word ERROR in the last hour.”
Winner: Sentry — by a wide margin for application error tracking.
Sentry provides application-level performance monitoring:
CloudWatch provides infrastructure-level performance monitoring:
Winner: Depends. Sentry wins for application performance (where in my code is it slow?). CloudWatch wins for infrastructure performance (is my server running out of memory?).
Sentry is not a log management tool. It captures error events, not log streams. You can attach breadcrumbs and context to errors, but Sentry is not designed to store and search terabytes of application logs.
CloudWatch Logs is a full-featured log management service:
Winner: CloudWatch — it is a dedicated log management platform. Sentry does not compete in this category.
Sentry alerting is issue-based:
CloudWatch alerting is metric-based:
Winner: Tie. They alert on fundamentally different things. Sentry alerts on application errors. CloudWatch alerts on infrastructure metrics. You likely need both.
Sentry works anywhere:
CloudWatch is AWS-native:
Winner: Sentry for multi-cloud or non-AWS environments. CloudWatch for AWS-heavy architectures.
| Plan | Price | Includes |
|---|---|---|
| Developer (Free) | $0/month | 5K errors, 10K performance transactions, 1 user |
| Team | $26/month | 50K errors, 100K transactions, unlimited users |
| Business | $80/month | 50K errors, 100K transactions, advanced features |
| Enterprise | Custom | Volume discounts, dedicated support |
Additional usage is billed per event. Sentry offers spike protection to prevent surprise bills from sudden traffic increases.
CloudWatch uses pay-per-use pricing that can be complex:
| Component | Free Tier | Paid Rate |
|---|---|---|
| Custom metrics | 10 metrics | $0.30/metric/month |
| Alarms | 10 alarms | $0.10/alarm/month |
| Logs ingested | 5 GB/month | $0.50/GB |
| Logs stored | 5 GB/month | $0.03/GB/month |
| Logs Insights queries | — | $0.005/GB scanned |
| Dashboard | 3 dashboards | $3/dashboard/month |
Real-world cost example: A medium-sized application with 20 custom metrics, 15 alarms, 50GB of logs/month, and 2 dashboards costs roughly $35-50/month on CloudWatch. That is comparable to Sentry’s Team plan.
Winner: Sentry for predictable pricing. CloudWatch can get expensive with high log volumes but is “free” if you only use basic AWS service metrics.
Sentry setup (~10 minutes):
# Install the SDK
npm install @sentry/nextjs

# Initialize in your app
npx @sentry/wizard@latest -i nextjs
That is it. Sentry auto-detects errors, captures stack traces, and starts sending data immediately. The wizard configures source maps, release tracking, and performance monitoring.
CloudWatch setup (already running):
If you are on AWS, CloudWatch is already collecting basic metrics for your services. No setup needed for default metrics. However, custom metrics, detailed monitoring, and log collection require additional configuration:
Winner: Sentry for time-to-first-insight. CloudWatch for zero-config infrastructure metrics.
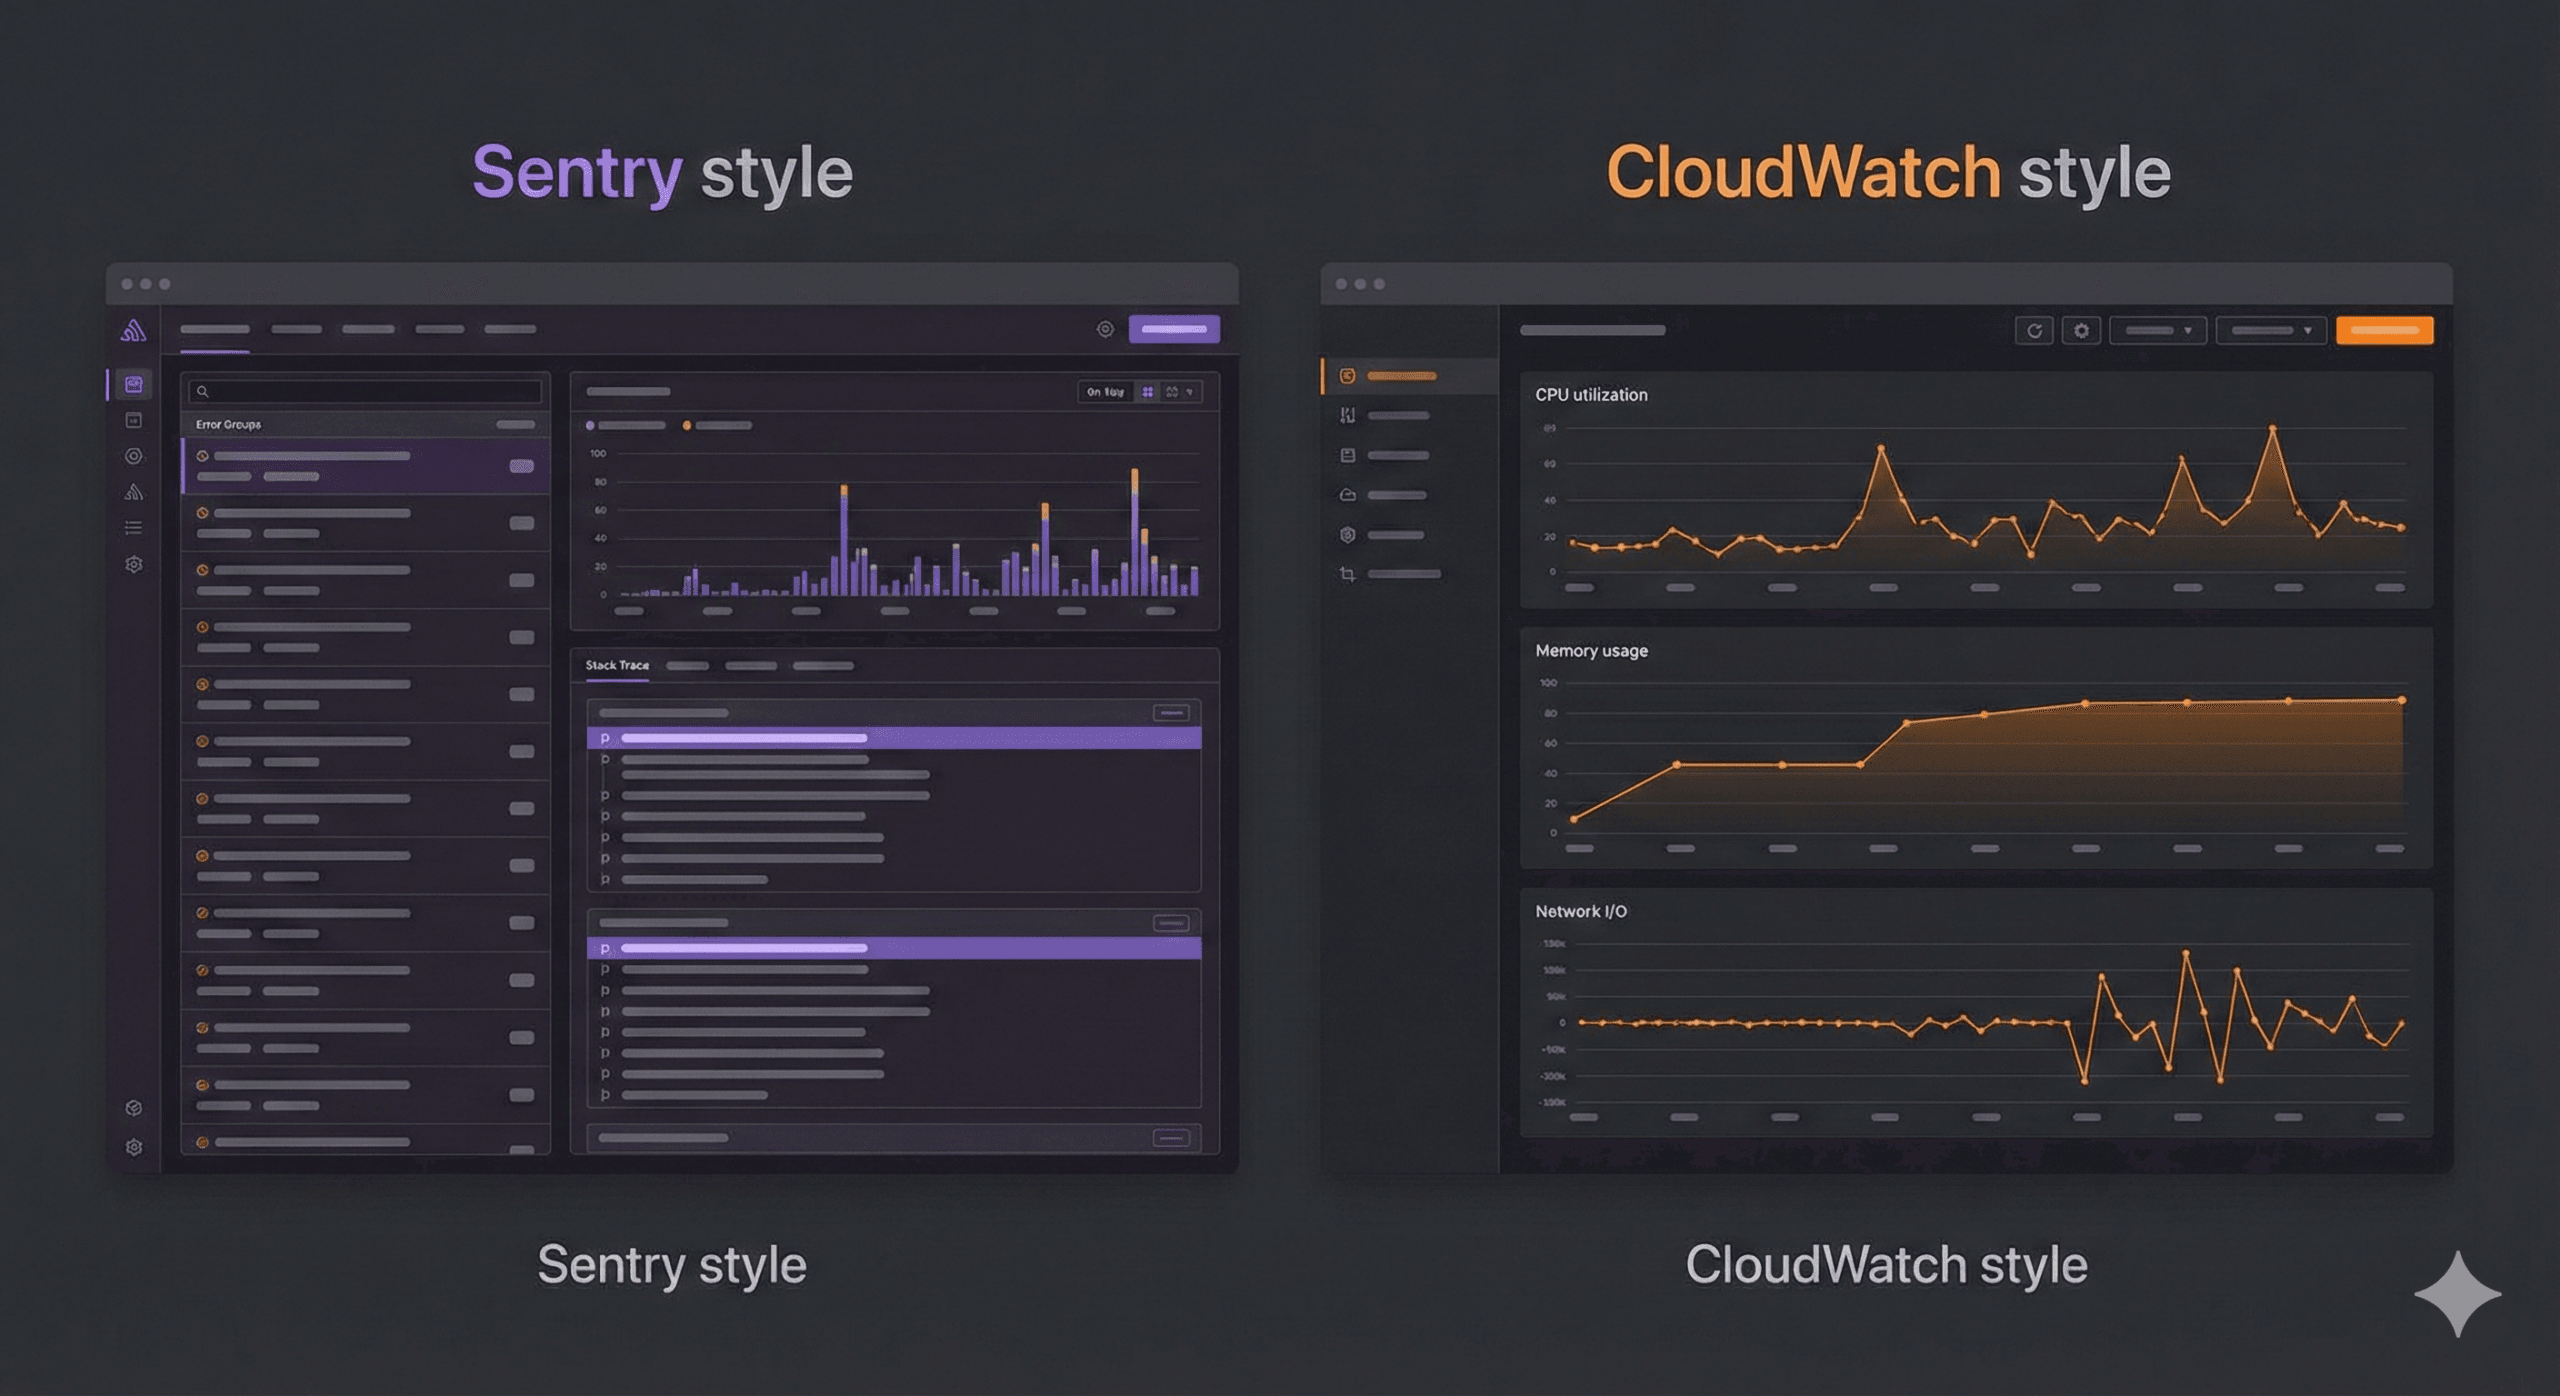
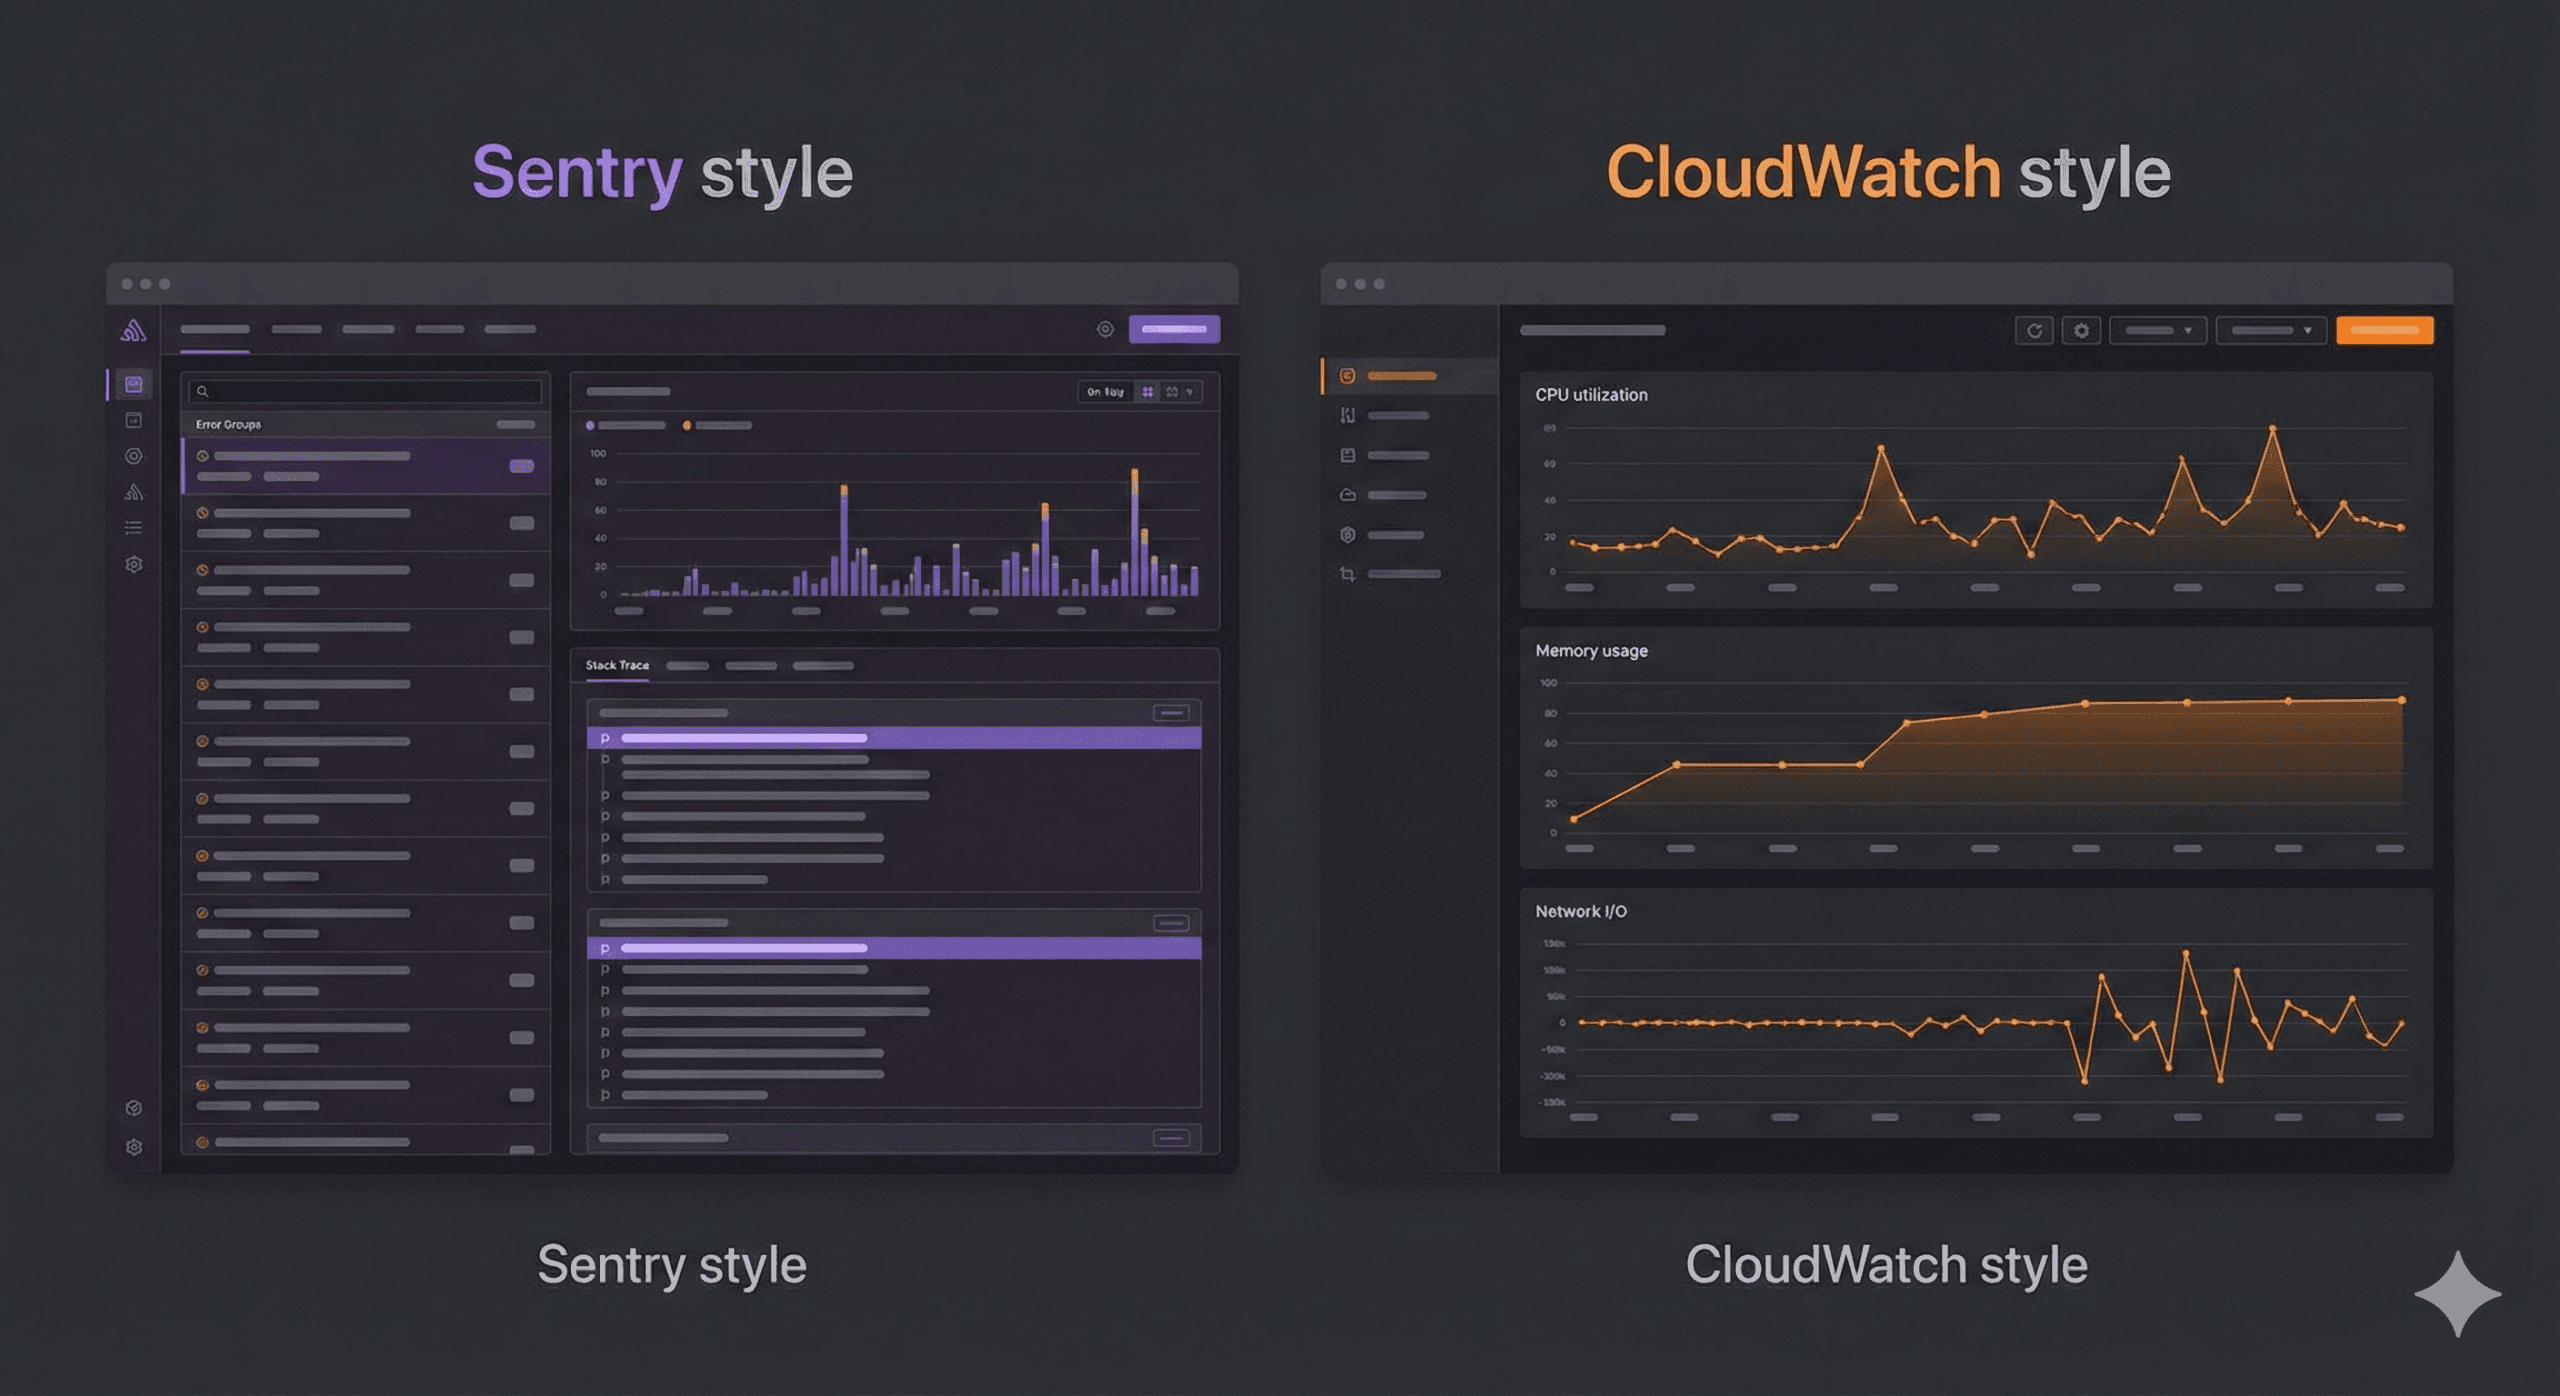
Sentry has a modern, developer-focused UI:
CloudWatch has a functional but complex UI:
Winner: Sentry — the UI is designed for developers and is significantly more intuitive for debugging. CloudWatch’s UI is powerful but has a steeper learning curve.
Choose Sentry when:
Sentry is not ideal for: Infrastructure monitoring, server resource tracking, log aggregation, or AWS-specific operational metrics.
Choose CloudWatch when:
CloudWatch is not ideal for: Application-level error tracking, frontend performance monitoring, or debugging specific code issues.
Yes — and most production teams do. Sentry and CloudWatch are complementary, not competing tools.
Here is how they work together:
| Scenario | CloudWatch Handles | Sentry Handles |
|---|---|---|
| Your API returns 500 errors | Tracks the spike in 5xx metrics, triggers an alarm | Captures the exact exception, stack trace, and affected users |
| Lambda function times out | Logs the timeout, tracks duration metrics | Shows which code path caused the timeout and why |
| Database connection pool exhausted | Monitors RDS connection count, sends alarm | Captures the ConnectionError with the query that failed |
| Memory leak in Node.js | Tracks EC2 memory usage trending upward | Captures OutOfMemoryError with heap snapshot context |
| Frontend JavaScript crash | Not applicable (CloudWatch is server-side) | Captures the error with browser info, user session, and replay |
The workflow looks like this:
TypeError: Cannot read property 'items' of null in checkout.js:142, started 20 minutes ago, affects 89 users, introduced in release v3.2.1v3.2.0, Sentry confirms the error stoppedCloudWatch tells you something is wrong. Sentry tells you what, where, and why.
Some teams also consider Datadog as an all-in-one alternative. Here is how it compares:
| Feature | Sentry | CloudWatch | Datadog |
|---|---|---|---|
| Error tracking | Excellent | Basic | Good |
| Infrastructure monitoring | None | Excellent | Excellent |
| APM | Good | Basic (Application Signals) | Excellent |
| Log management | Minimal | Good | Excellent |
| Pricing | Affordable ($26+/mo) | Pay-per-use | Expensive ($15+/host/mo) |
| Setup complexity | Low | Low (on AWS) | Medium |
| Best for | Dev teams | AWS ops teams | Enterprises wanting one tool |
When to choose Datadog: You want a single platform for infrastructure, APM, logs, and error tracking, and you have the budget. Datadog starts at $15/host/month for infrastructure monitoring, plus additional costs for APM, logs, and error tracking — which can add up quickly for larger deployments.
When to skip Datadog: You are a small-to-medium team and the cost is not justified. Sentry (errors) + CloudWatch (infrastructure) gives you 90% of Datadog’s value at a fraction of the cost.
Yes, Sentry offers a free Developer plan that includes 5,000 errors per month, 10,000 performance transactions, and 500 session replays. It is limited to one user, but it is a great way to try Sentry before upgrading. The Team plan starts at $26/month with unlimited users.
Sort of. CloudWatch can detect errors in logs using metric filters (matching patterns like “ERROR” or “Exception”), but it does not provide stack traces, error grouping, or debugging context. For true application error tracking, you need a dedicated tool like Sentry.
They serve different purposes. Sentry is better for application error tracking and debugging. CloudWatch is better for infrastructure monitoring and log management. Most teams use both. Comparing them directly is like comparing a debugger to a server dashboard — they solve different problems.
For a complete monitoring stack on AWS, we recommend:
This combination covers infrastructure health, application errors, and performance monitoring without the cost of an all-in-one platform like Datadog.
Yes, Sentry is open-source and can be self-hosted. The self-hosted version is free and includes most features. However, self-hosting requires managing the infrastructure (PostgreSQL, Redis, Kafka, ClickHouse), which is a significant operational burden. Most teams find the hosted version more cost-effective.
Sentry’s SDK is designed to be lightweight. It adds minimal overhead (~1-5ms per request for performance monitoring). Error capture only runs when an exception occurs. You can configure sample rates to reduce the volume of performance data collected if needed.
Sentry and CloudWatch are not competitors — they are partners in a complete monitoring stack.
If you are forced to choose one: pick CloudWatch if you are an ops-focused team running serverless workloads entirely on AWS. Pick Sentry if you are a development team shipping features fast and need to catch bugs before your users report them.
But the best answer? Use both. CloudWatch is already running if you are on AWS. Adding Sentry takes 10 minutes and immediately gives you superpowers for debugging production issues.
Need help setting up production-grade monitoring for your application? At Metosys, we specialize in monitoring with Sentry, Prometheus & CloudWatch and real-time metrics and reporting systems. We can design a monitoring stack that catches bugs before your users do. Get in touch to discuss your setup.
Sources:
Was this article helpful?

Stay in the know with insights from industry experts.