
Have you ever been navigating a critical application, and suddenly—POOF—it just stops working? Maybe the screen freezes, or a process fails silently in the background. These technical failures, or bugs, are like invisible friction points that crawl into the codebase and disrupt the user experience.
For developers, identifying the root cause of these issues in a production environment is like playing a game of Where’s Waldo?—except Waldo is invisible and hiding within millions of lines of distributed code. This is where Sentry comes into play.
In this comprehensive guide, we will explore why Sentry is considered the gold standard for error tracking, and we will compare it against industry heavyweights like AWS CloudWatch, Splunk, and Google Analytics. Whether you are managing a small startup or a global enterprise, choosing the right “digital detective” is critical for your 2025 technology roadmap.
To understand sentry working, imagine your application as a complex machine. Every time a component fails or a calculation goes wrong, a specialized “watchdog” (Sentry) immediately records the state of the machine and alerts the maintenance team.
First, developers integrate a lightweight library into their application, known as an SDK. Think of this as giving your codebase a nervous system. This monitor doesn’t track private user behavior; it strictly watches the code execution. When the application encounters an unhandled exception, the SDK intercepts the data before the session ends.
When an error occurs, Sentry captures an “event.” This is similar to a detective collecting a detailed report from a crime scene. Inside this event, Sentry includes:
All captured events are sent to Sentry’s centralized platform. Rather than showing a raw list of logs, Sentry uses “fingerprinting” to group identical errors into single “Issues.” This prevents noise and allows developers to prioritize the most critical failures first.
By observing sentry working in real-time, engineering teams can shift from reactive firefighting to proactive resolution, fixing bugs before they spiral into system-wide outages.
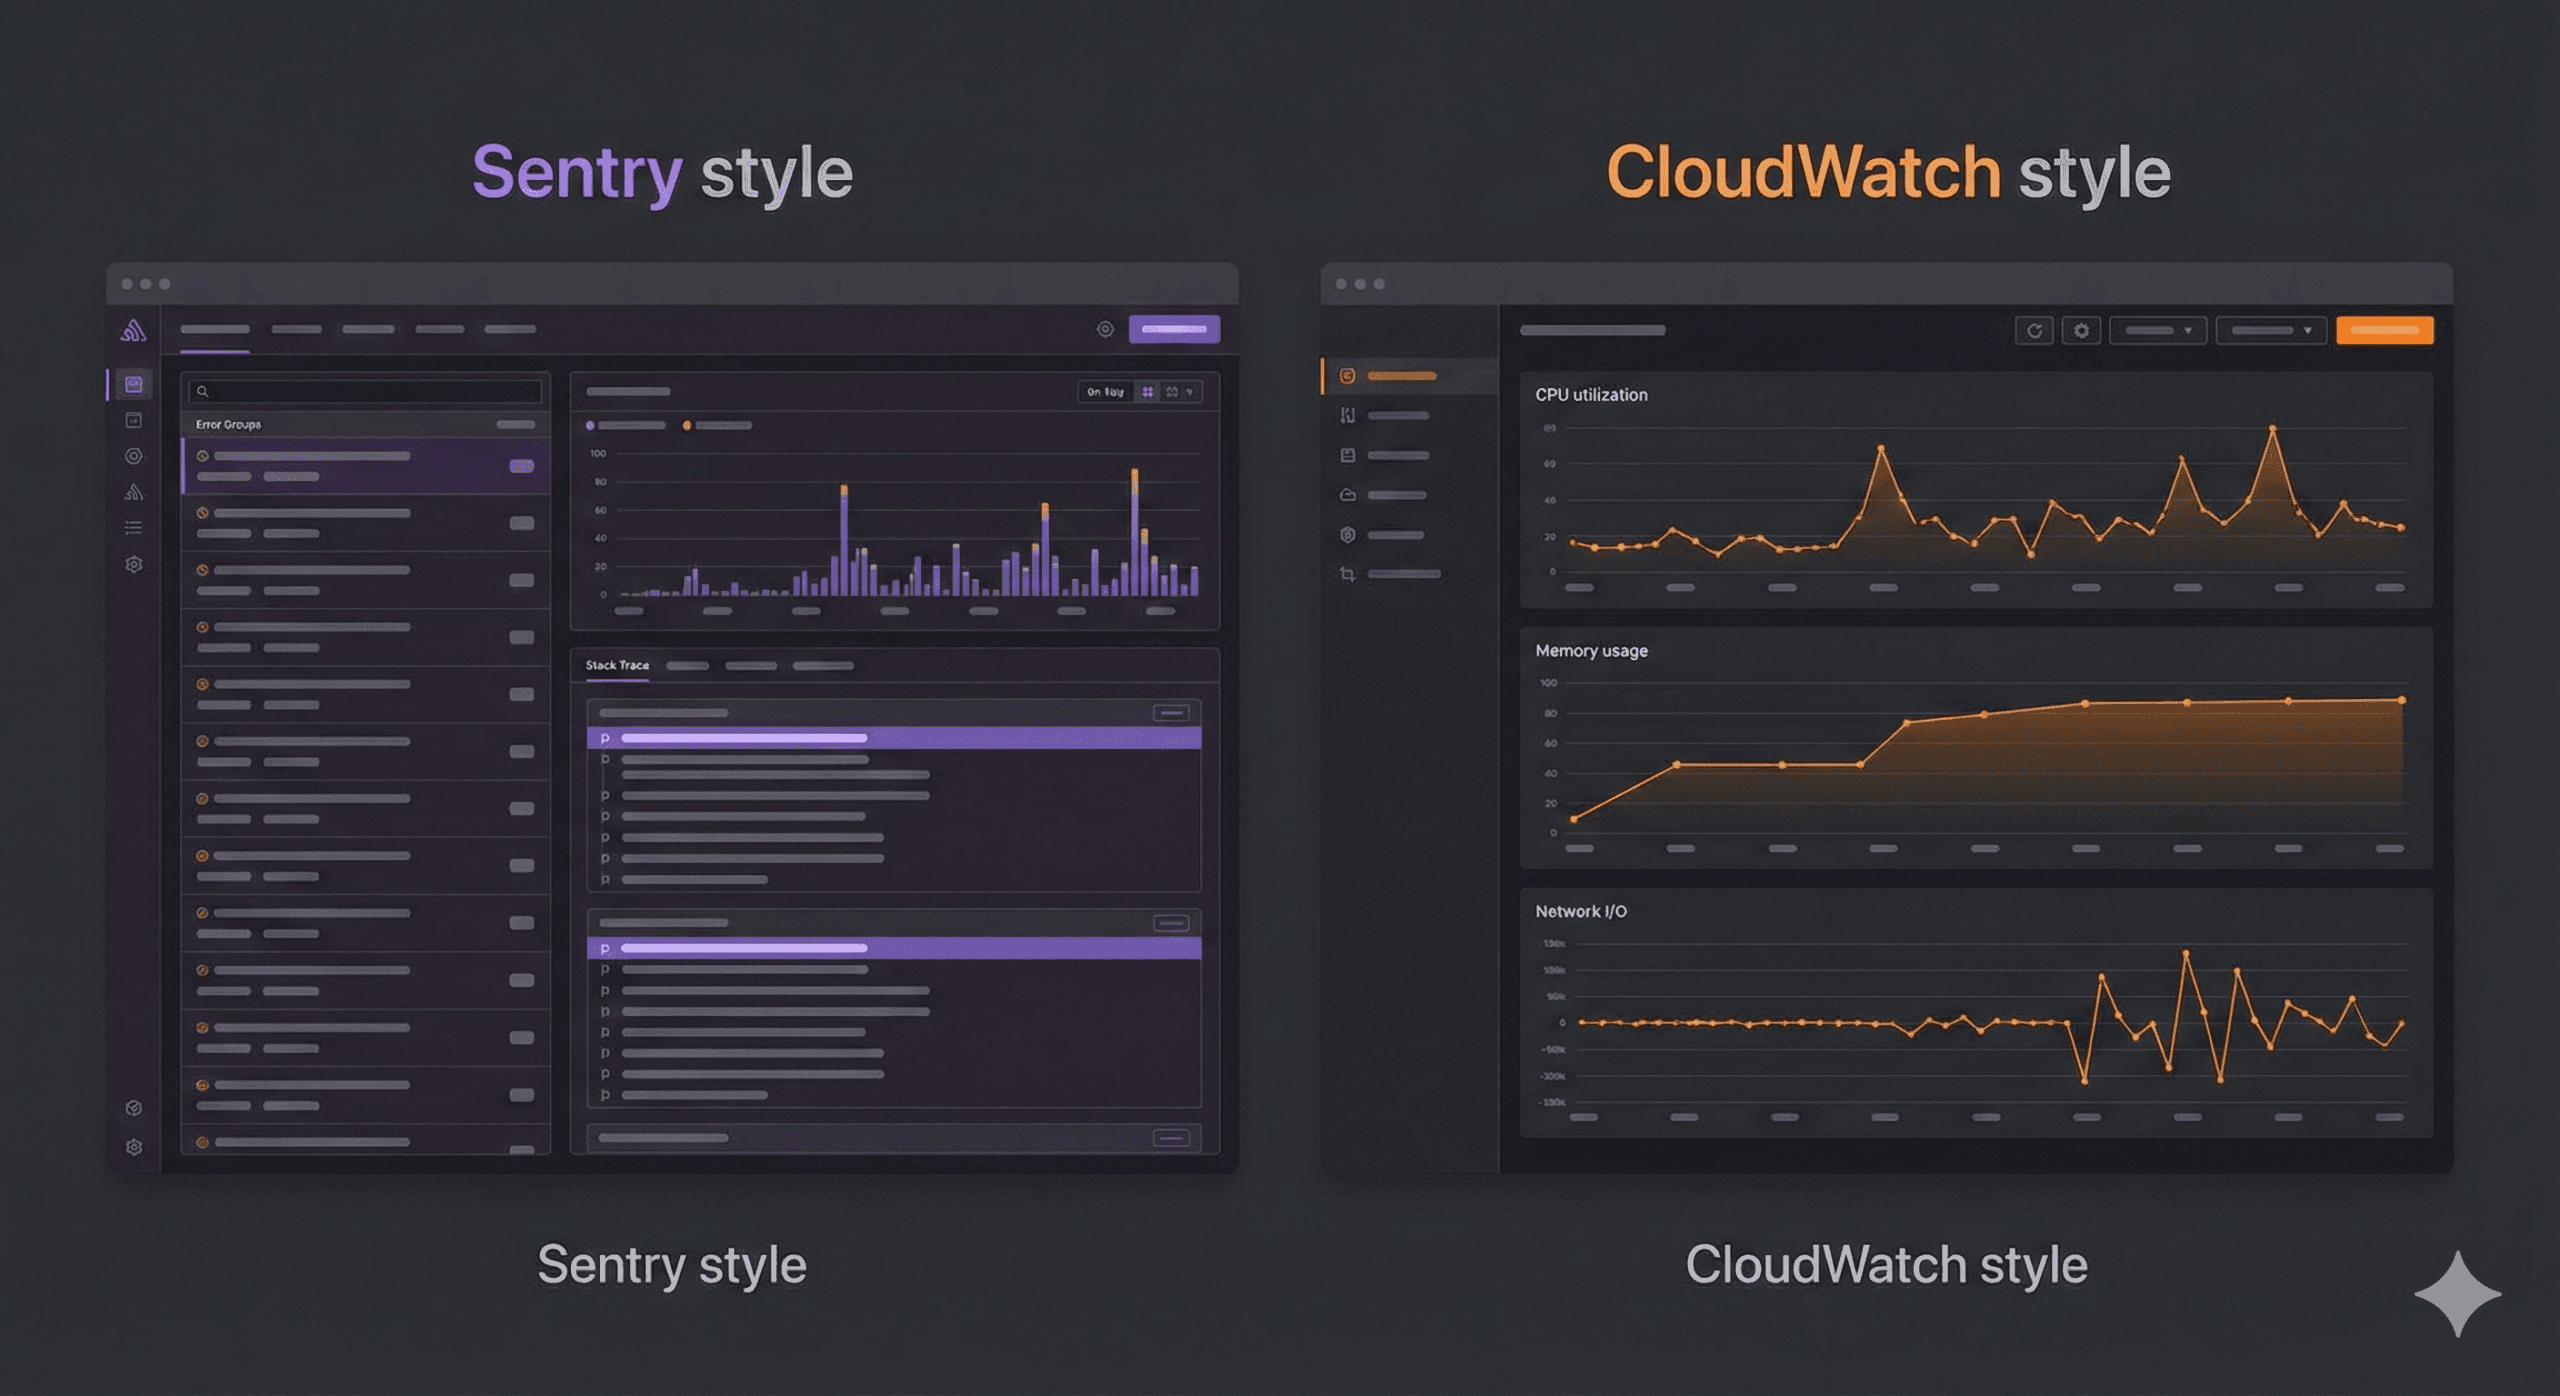
One of the most frequent debates in the DevOps world is sentry vs aws cloudwatch.
Imagine managing a high-rise skyscraper.
When evaluating sentry vs aws cloudwatch, you are essentially choosing between infrastructure monitoring and application-level code monitoring.
Modern enterprises typically use both. CloudWatch monitors the “host” (your AWS resources), while Sentry monitors the “guest” (your application code).
When discussing sentry vs aws, it’s important to remember that AWS is a vast cloud ecosystem offering hundreds of services. Sentry is a specialized, best-in-class tool for a single purpose: error management.
While AWS offers logging tools (CloudWatch Logs), they are often raw and require significant manual filtering. Sentry transforms that raw data into actionable intelligence, providing a developer experience that a general-purpose cloud provider struggles to match.
AWS offers a specialized feature called RUM (Real User Monitoring). When comparing sentry vs cloudwatch rum, it’s helpful to distinguish between how a user moves through your app and why their experience broke.
If your goal is to optimize the global speed of your website, CloudWatch RUM is an excellent choice. However, if your goal is to minimize time-to-fix for code regression, Sentry is the clear winner. In the sentry vs cloudwatch rum showdown, Sentry provides the “why” while RUM provides the “where.”
If you browse tech communities like Reddit, you will find heated discussions regarding sentry vs cloudwatch reddit.
A common sentiment on Reddit is that while CloudWatch is comprehensive, it is notoriously “noisy” and lacks a cohesive user interface (UI). One user might say, “I use CloudWatch because we are already on the AWS stack,” while another responds, “Sentry’s UI allows my team to solve in 5 minutes what took 2 hours in CloudWatch Logs.”
The community consensus on sentry vs cloudwatch reddit generally follows these three points:
Ultimately, the sentry vs cloudwatch reddit threads suggest a hybrid approach: Use CloudWatch for system health and Sentry for application-level observability.
For teams operating within the Microsoft ecosystem, the comparison is often sentry vs application insights.
The choice in sentry vs application insights often comes down to portability. If you ever plan to move part of your stack out of Azure, Sentry’s cross-platform nature ensures your observability doesn’t break. Furthermore, many developers find Sentry’s focus on “Issue grouping” to be superior to the raw telemetry viewing in Application Insights.
Finally, let’s look at sentry vs splunk. This is a comparison between a scalpel and a chainsaw.
In the sentry vs splunk debate, companies often find that Splunk is too expensive and slow for simple error tracking. Sentry is built to help a developer fix a bug in minutes. Splunk is built to help a data analyst find patterns over weeks.
A prevalent misconception in the industry is that a website with traffic analytics doesn’t need error monitoring. This brings us to the sentry vs google analytics comparison.
Consider the operation of an E-commerce Platform.
In the world of sentry vs google analytics, these tools are complementary. Google Analytics might report a high bounce rate on your checkout page, but without Sentry, you won’t know if users are leaving because the price is too high or because the checkout script is crashing.
For teams looking to optimize their budget, the question of cost is paramount. When researching sentry self hosted pricing, it is vital to look beyond the $0 price tag of the software license.
Sentry is an open-source project, meaning you can host the core platform on your own infrastructure for free. However, “free” often refers to the license, not the total cost of ownership (TCO).
Key considerations for sentry self hosted pricing include:
Ultimately, the decision on sentry self hosted pricing depends on your team’s size. Small teams usually save money and time by using Sentry’s SaaS tier, while giant enterprises with existing Kubernetes clusters might find value in self-hosting.
The final technical concept to master is the sentry rate. This refers to the volume of events your application sends to the monitoring platform.
In a high-traffic environment, a single recursive bug can trigger millions of errors in seconds. If your sentry rate is not managed properly, two things happen:
Developers manage the sentry rate through “Sampling.” By setting a sample rate (e.g., 10%), Sentry only ingests one out of every ten events. This provides enough statistical data to identify patterns without blowing your budget or overwhelming your engineers.
We have covered a significant amount of ground, from comparing sentry vs cloudwatch rum to deconstructing the hidden costs of sentry self hosted pricing.
The most important takeaway is that observability is not a “one size fits all” solution. Leading engineering teams often adopt a multi-tool approach:
If you are just starting out, prioritize Sentry. Its developer-first approach and the transparency of its sentry working model make it the most effective tool for maintaining high application quality. By integrating Sentry today, you are not just tracking errors—you are investing in a better experience for your users.
Once you have mastered the basics of comparing sentry vs aws cloudwatch, you can begin implementing advanced strategies to further harden your application.
In 2025, Sentry introduced advanced AI capabilities that go beyond simple error reporting. The platform can now analyze a crash and suggest specific code fixes (Source Map awareness). This is a primary differentiator when evaluating sentry vs aws—while AWS provides the data, Sentry provides the answer.
A key advantage of Sentry is its ability to integrate with your existing developer workflow. By connecting Sentry to tools like Slack, Microsoft Teams, or GitHub, your engineering team receives real-time notifications about regressions. This reduces the “mean time to resolution” (MTTR) far more effectively than manually searching through logs in sentry vs splunk.
Are you still confused? Don’t worry! Here is a simple checklist to help you decide which superhero tool belongs in your digital treehouse:
| If your primary goal is to… | Use this tool! | Reason for selection |
|---|---|---|
| Debug code-level production crashes | Sentry | Direct mapping to source code and line numbers. |
| Monitor server CPU and infrastructure | AWS CloudWatch | Native integration with AWS resource health. |
| Understand user interaction latencies | CloudWatch RUM | Excellent for tracking frontend performance metrics. |
| Use the community-preferred tool | Sentry | High developer sentiment on Reddit for UI/UX. |
| Standardize on the Microsoft stack | Application Insights | Frictionless integration with .NET/Azure. |
| Perform deep security/compliance audits | Splunk | Unmatched capacity for massive log ingestion. |
| Track marketing and user funnel data | Google Analytics | The industry standard for behavior analytics. |
To solidify your understanding of sentry working and the broader observability landscape, keep this glossary handy:
In 2025, the barrier between success and failure is often the speed at which a team can identify and resolve technical debt. By understanding the nuances of sentry vs cloudwatch rum, evaluating sentry self hosted pricing objectively, and acknowledging the strengths of sentry vs application insights, you are empowered to make a data-driven decision.
Start small, focus on the errors that impact your users most, and leverage the transparency of sentry working to build more reliable software.
Was this article helpful?

Stay in the know with insights from industry experts.